DATABOOST RETENTION AND CHURN ANALYSIS
Retention and churn, Segmentation, Churn drivers
2023
produdct Analytics

Project info
company name:
DATABOOST
Company Overview:
Databoost is a growing SaaS startup that provides a collaborative productivity platform for small and medium scale businesses to large enterprises. Allowing them manage projects, create task boards, track deadlines, and integrate with popular tools like Google Drive and Slack.
Core Features:
Task Boards
Calendar & Deadline Reminders
Team Collaboration Tools
File Attachments & Comments
Integrations with external platforms (Slack, Google Drive, Trello)
Business Model:
They offer four different plan types for these businesses
Free package
Starter package
Growth packages
Enterprise packages
Current Business Problem:
Databoost has been doing well and gaining widespread recognition amongst task managers, small and medium sized businesses as well as large scale enterprises. But in recent times, Stakeholders noticed user drop-off in product usage. Although the drop-offs are still fresh and are under supervision.
Stakeholders want to know;
The degree of churn/drop-offs (Quantify churn rate)
Where churn is happening (Segmentation analysis) and why
Business recommendations to reduce churn and increase retention
Key Business Questions
What is the current churn rate overall and across different user segments?
Why are users churning? Are they getting value from our product?
What feature of our product is experiencing a high churn rate?
What segment is churning more?
Which of our packages is churning more?
Do plan types affect churn rate?
Who is churning more between free users and pro users?
What are the activities of paid users or subscribers and that of free users before churn?
Key Metrics to Track
Churn Metrics
Churned users
Retained users
Churn rate= Churned Users / Total Users
% Churn = Churned Users / Total Users*100 (to 2 d.p)
Segmentation Analysis
Country with the most churn rate
Churn rate across user segment
Churn rate across paid users
User behaviour Analysis
Churn rate across event type
Churn rate across plan type
DATASET OVERVIEW
User table
Column | Description |
user_id | Unique identifier for user |
signup_date | Date the user signed up |
is_paid | Boolean flag for paid accounts |
cancel_date | If churned, the date of cancellation |
country | User’s country (for segmentation) |
Events table
Column | Description |
user_id | Matches user table |
event_type | e.g., 'login', 'upload', 'invite' |
event_time | Timestamp of the event |
Subscription table
Column | Description |
user_id | Matches user table |
plan_type | Free, Basic, Pro, Enterprise |
start_date | Start of billing cycle |
end_date | End of billing or churn date |
is_active | Boolean (active = true) |
Unique Counts
Users: 3,000
Subscriptions: 3,000
Events: 80,745 total
Churned Users: 1,041
DAIGNOSTICS/ ANALYSIS
total numbers of users
select count(*)
from databoost_users;
There were 3000 users for this analysis.
numbers and % numbers of retained users(true) vs churned users (false)
select is_active, count(is_active)as subscribers,round(count(is_active)/3000*100,2) as pecentage_suscribers
from databoost_subscriptions
group by is_active;
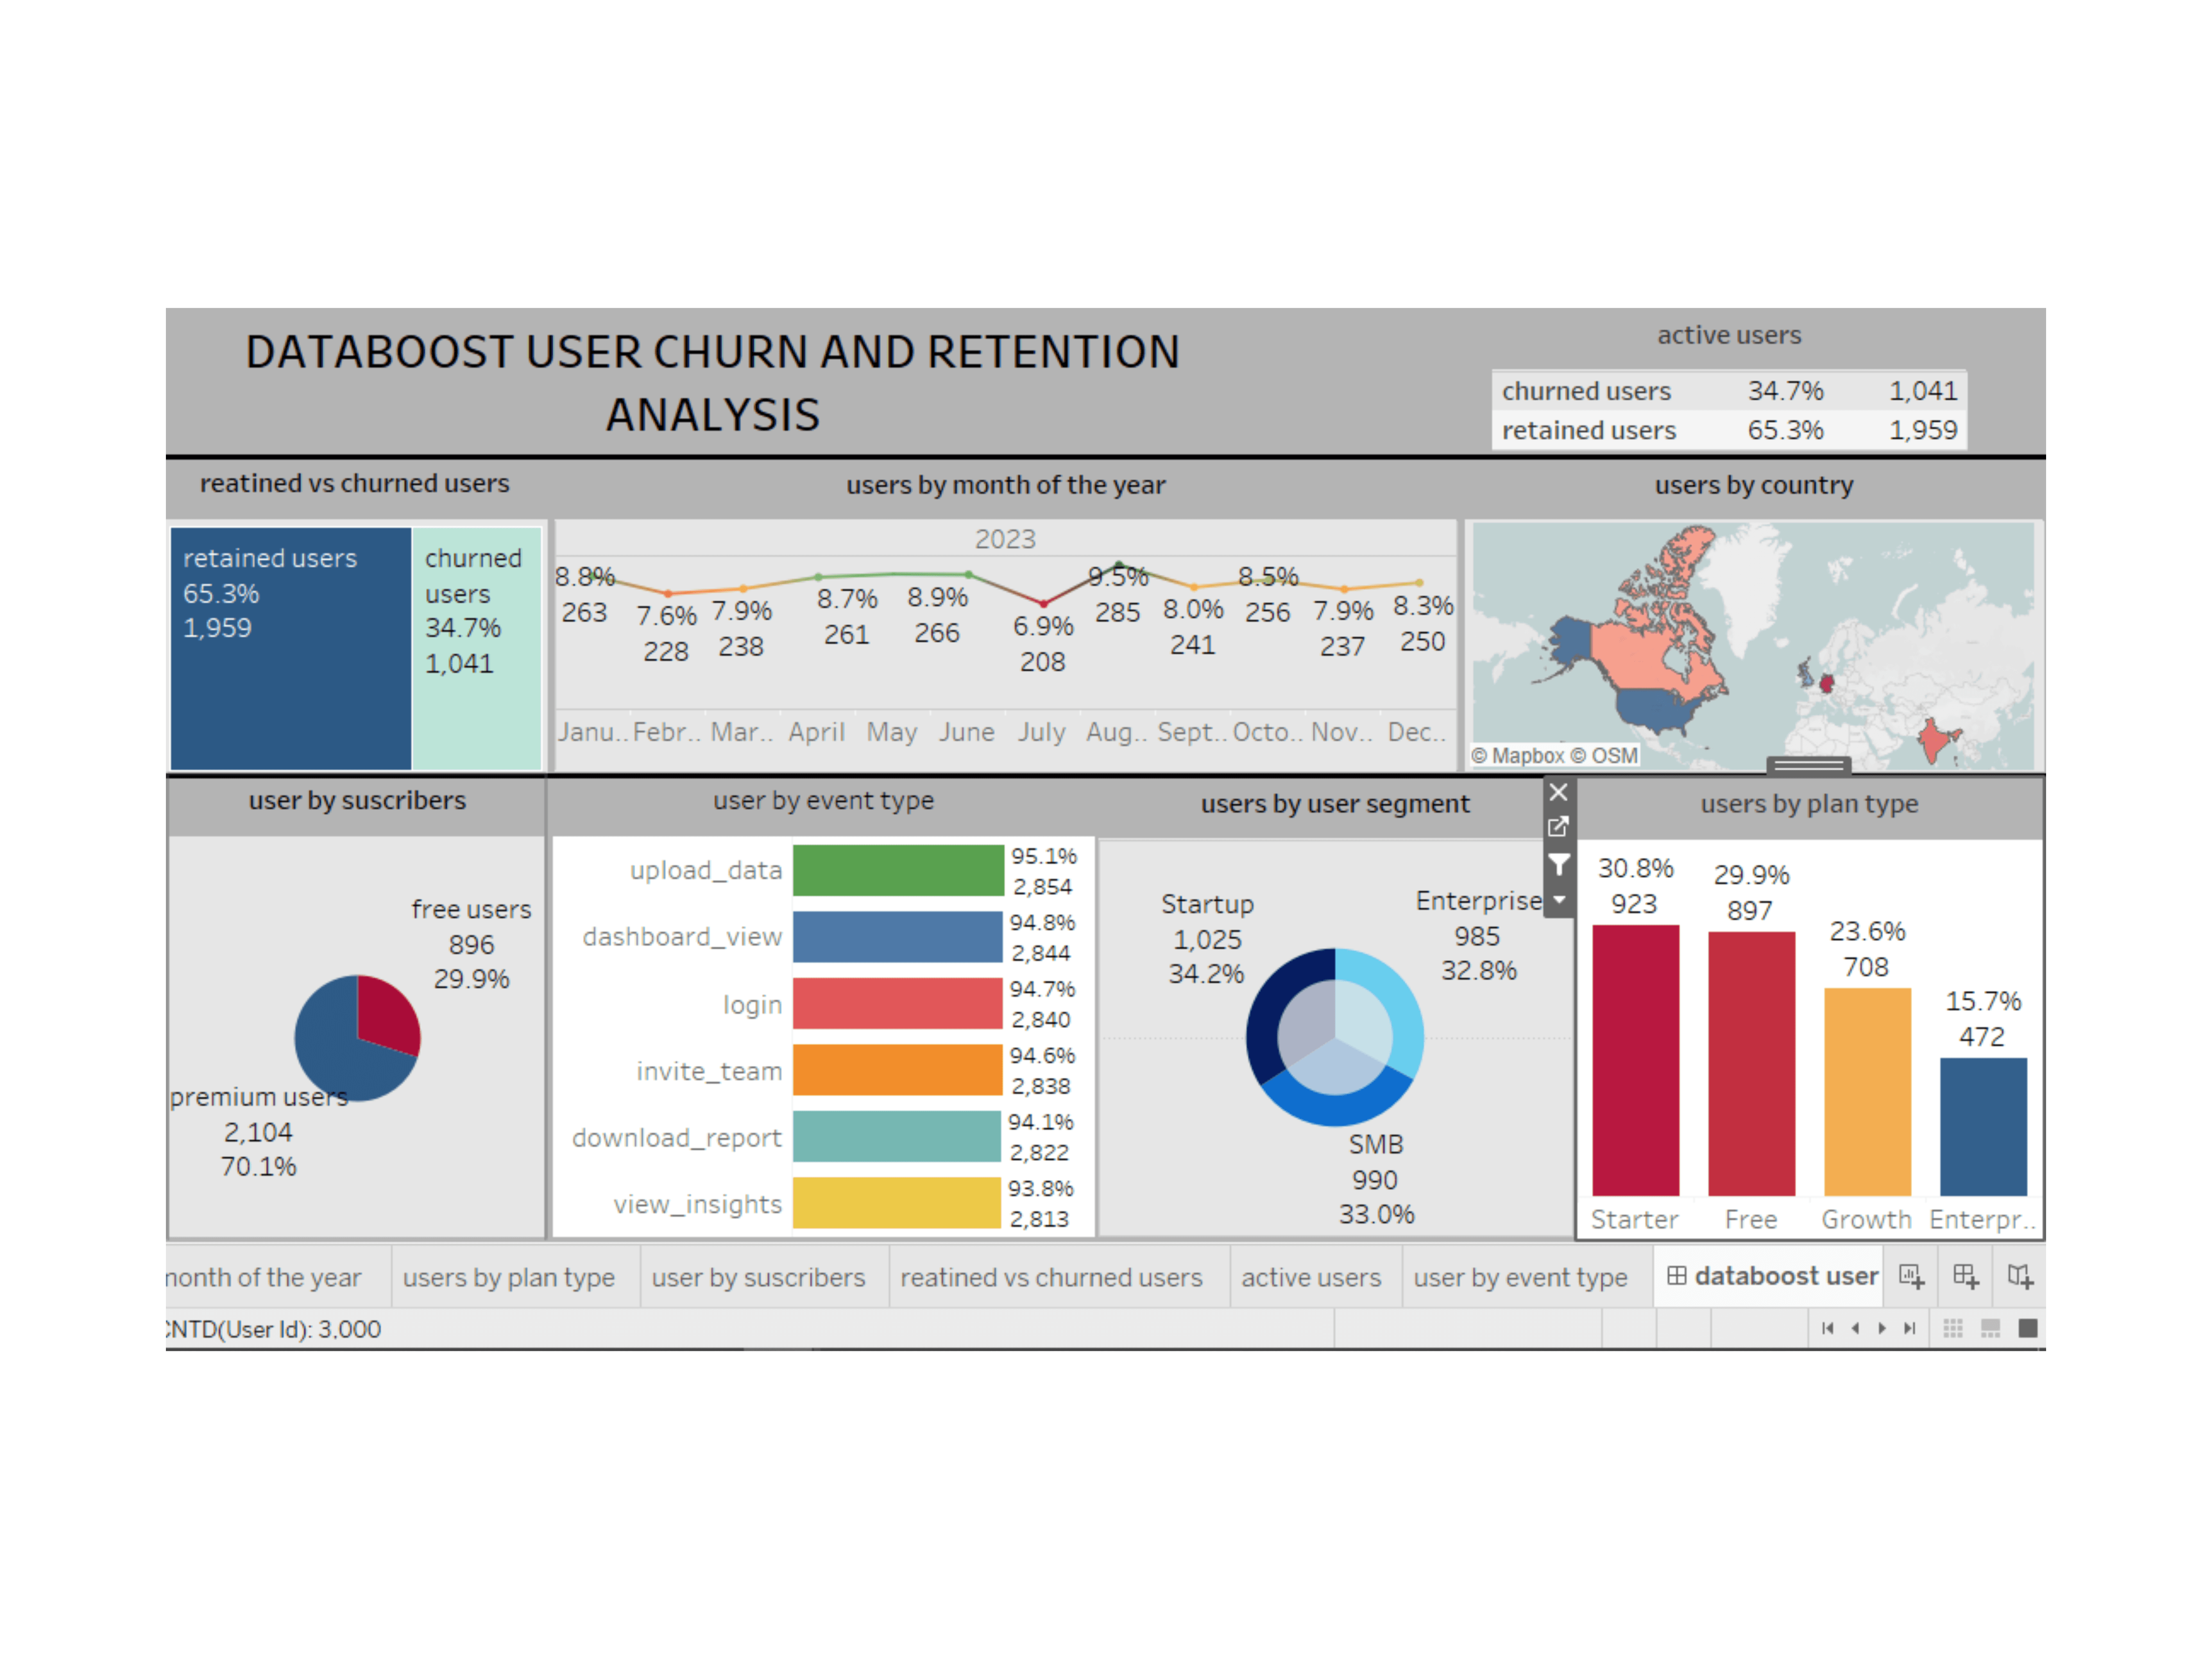
Retained users amount to 1959 which makes up 65%
While churned users amount to 1041 which makes up 34% of total users
These shows that a large numbers of users are beginning to dropoff
Segmentation analysis
Country with the most churn rate
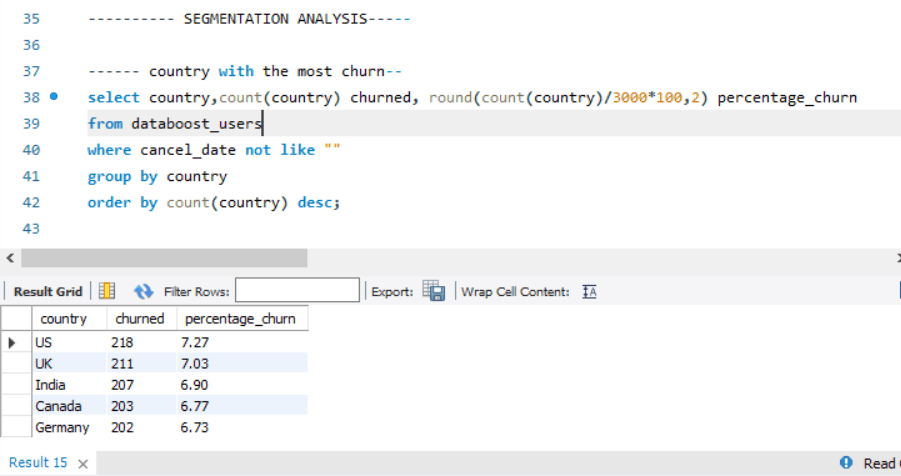
Churn is slightly even across all countries , but the United States is currently experiencing the highest number of churn by users, making up 7% of the 34% churned closely followed by the United Kingdom. This calls for an immediate action in these region to curb churn and increase retention
Churn rate across user segment
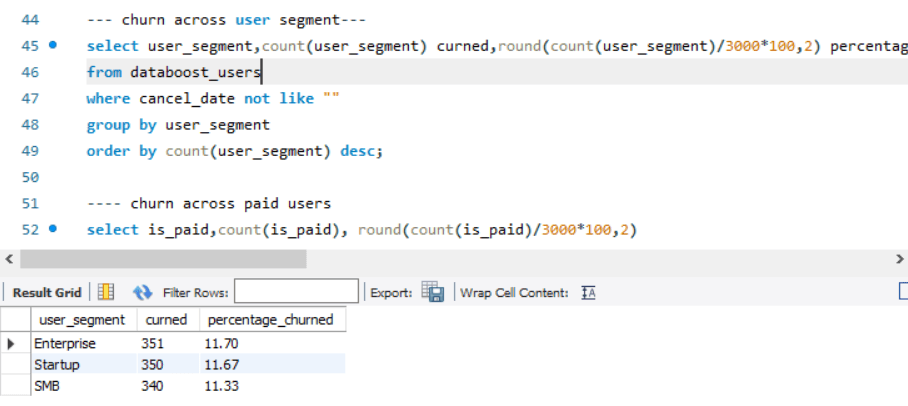
Again, churn is slightly even across user segment, however, Large enterprises are dropping off from using our tool with 351 users churning amounting to 11%
Since all user segments are experiencing massive drop off of about 11% across the board, we are to treat all segments as important problems to solve.
Churn for large enterprises likely translates to users no longer finding value in our products or have gotten another better product by our competitors.
Churn for startups likely translate to users not getting immediate value in our products also other contributing factors would be user experience and features not being startup friendly
Churn for small and medium scale businesses likely translate to prices of subscription being slightly overpriced for their type of business.
Churn rate across subscribers
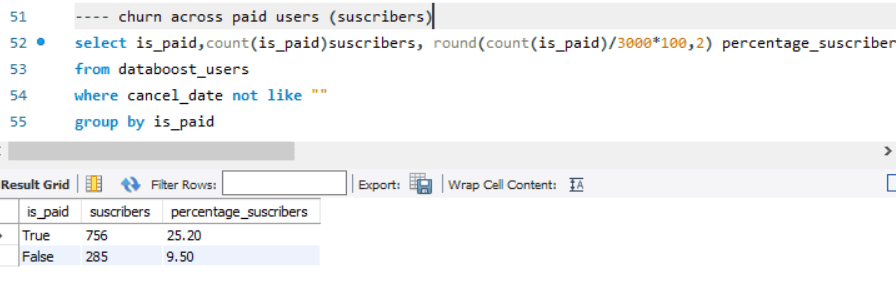
There is a 16% difference between paid users who unsubscribed and free users who unsubscribed
This simply means that a large number of paid users have tested our products and have seen reasons not to continue with us.
User behavior
Churn rate across event types
Paid and free users that churned
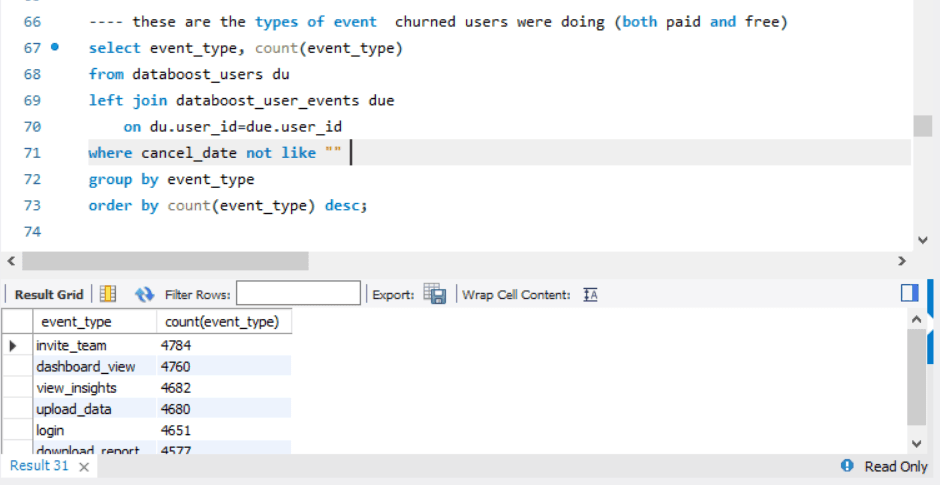
These were the activities of both paid and free users.
The invite team and dashboard view features are the highest common factor causing churn, this means churned users are looking for products with the best collaboration features and dashboard view.
Churn rate across event types
paid users that churned
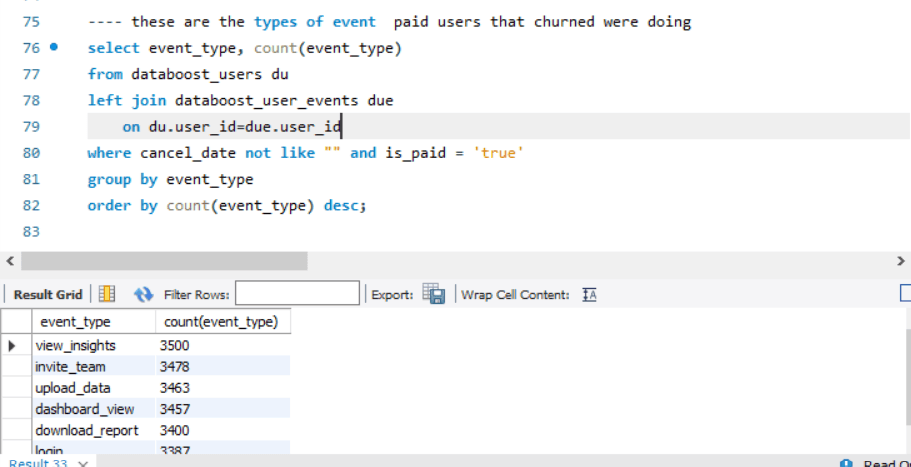
Churn here is even across the board for paid users who unsubscribed
The view insight, invite team , upload data , dashboard view and download report features were the has high activities amongst paid users that churned
This means that these features are what these sets subscribers are actively looking for, and they did not derive that satisfaction from our product
In order to retain future users with similar needs we need to upgrade these features.
Plan types
plan types of paid and free users that churned
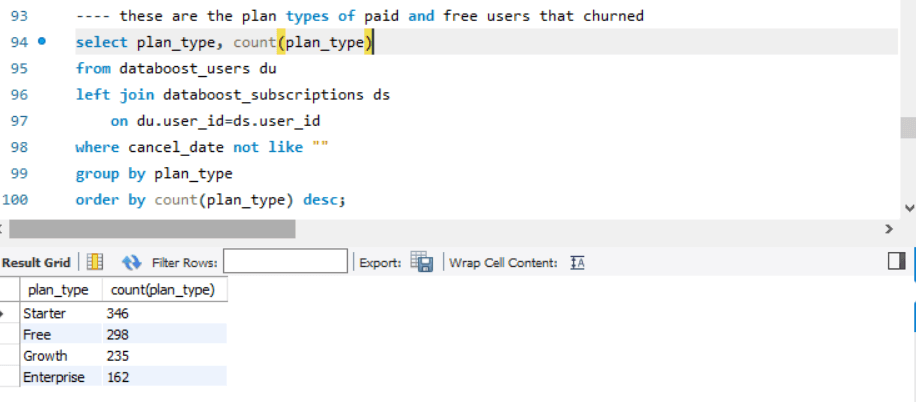
Users using the starter plan churn the most with over 300 users dropping off, this simply means that the package feature of the starter plan fell below expectation to the user or users are not satisfied with the package.
Plan types
plan types of paid users that churned
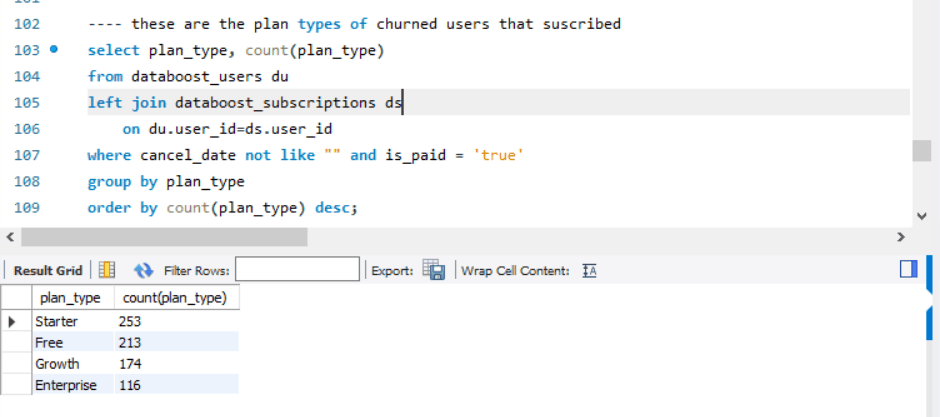
The starter plan and the free plan packages are experiencing the highest churn rates with 253 and 213 users churning respectively
This simply means that these users did not get value for money paid on these packages , or packages fell below expectation, or packages are slightly overpriced for the features they could get and they saw no need to continue with our products.
We need to revisit our plan type structure especially for the starter and free packages to meet customers needs.
SUMMARY OF FINDINGS
Three thousand users were analysed for this project
One thousand and forty one (1041) users dropped off putting the churn rate at 34%.
CHURNED USERS
102 users churned in the month of April making it the month with the highest churn
The US and the UK are demographics with the highest churn rate at 218 and 211 respectively
756 paid users churned while 285 free users churned. This means that our subscribers are beginning to leave our product. This calls for quick attention.
Churn users interact with the invite team and dashboard view more frequently before churn, this means that churn users are not satisfied with these features.
Enterprise and start ups are churning fast
Our starter and free user packages are churning fast
PAID USERS (SUSCRIBERS) WHO CHURNED
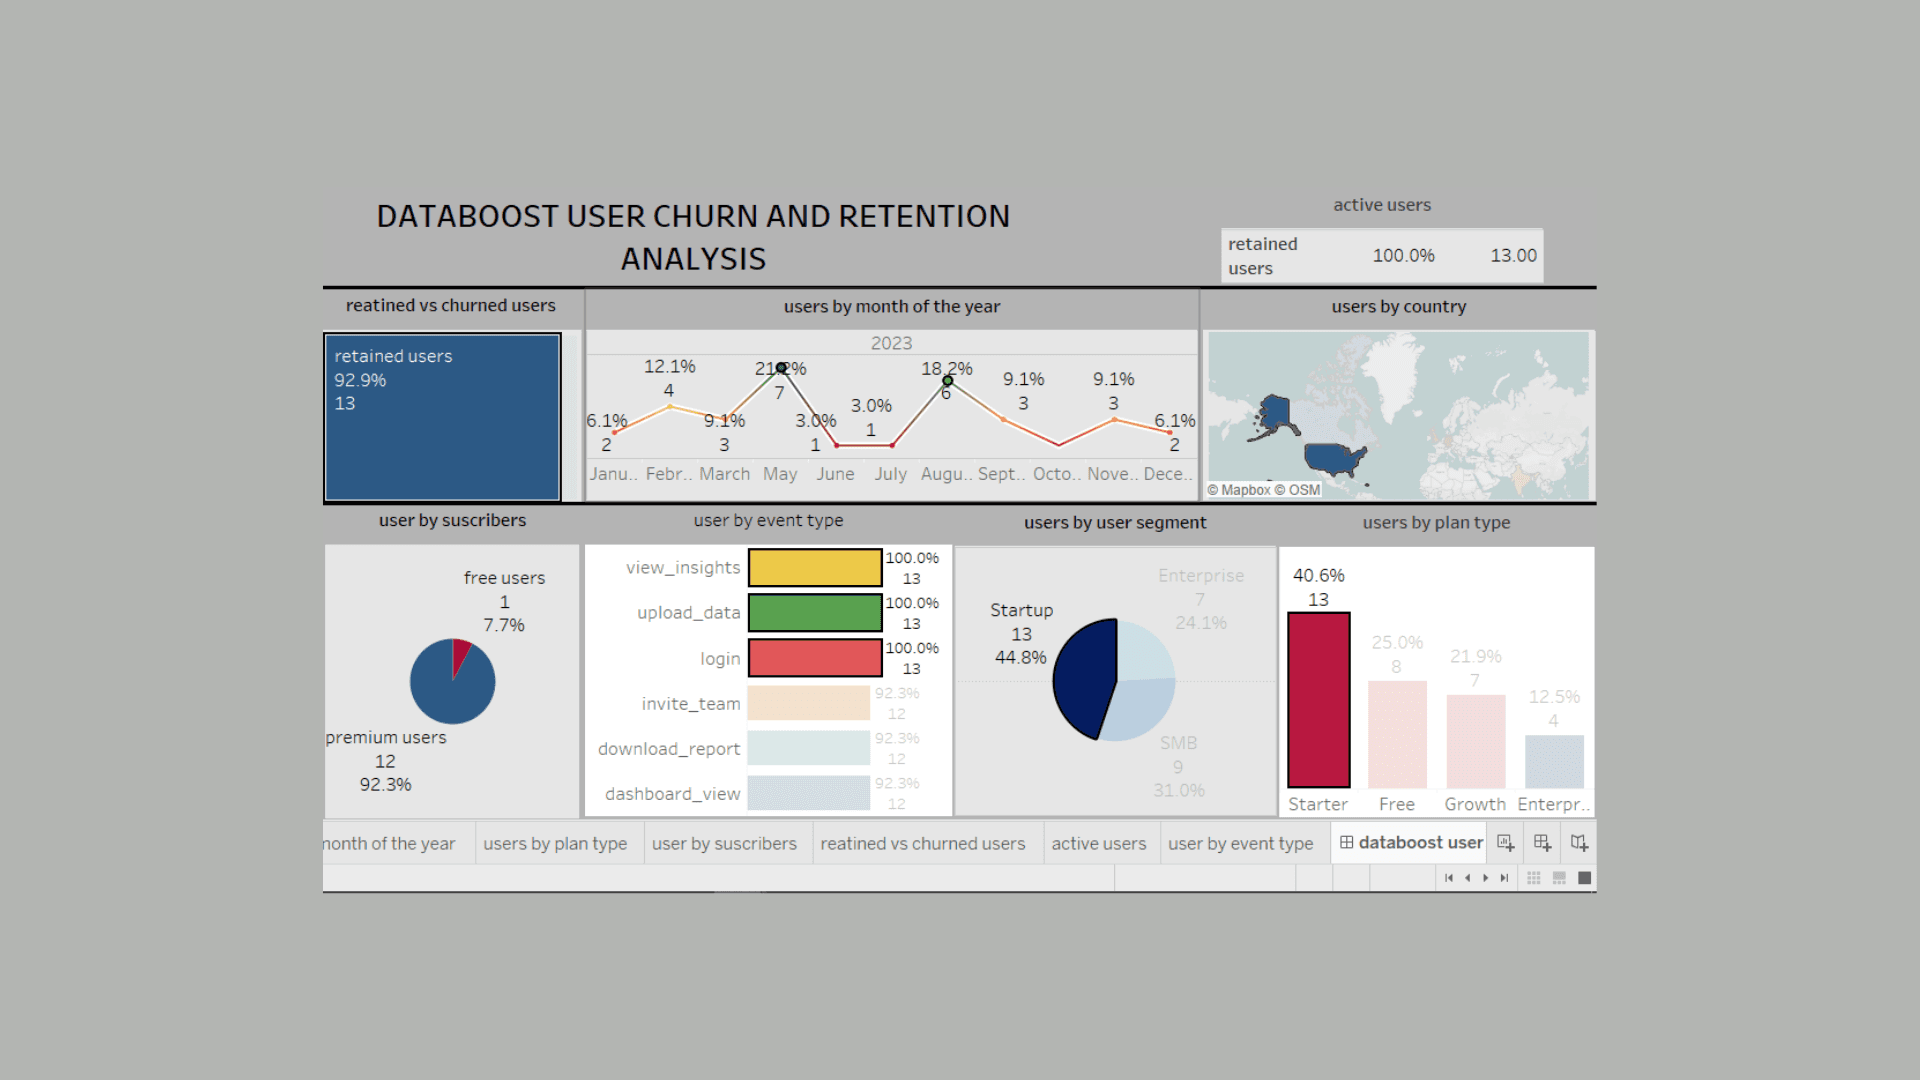
The month of April had the highest number of churn sitting at 77 users
The US and the UK experienced the highest number of churn at 161 and 150 users respectively
Paid users who churned used the view insight and invite team feature more before they dropped off
Businesses in the start up and enterprise category are dropping off steadily
Our starter and free user packages are churning fast
FREE USERS WHO CHURNED
Free users churned more in the month of October and December
Free users who churned more were from the US or India
Free users who churned interacted more with invite team and dashboard view the most before churning
Free users who churned were businesses from the enterprise and the smb category
Free users who churned tried our free and starter packages more before churning
BUSINESS RECOMMENDATIONS
1. Product Team – Improve Engagement & Feature Adoption
Finding: Churned users are showing dissatisfaction in our product features after interaction
Recommendation:
Implement feature tutorials, in-app walkthroughs, and goal-setting onboarding to improve early engagement.
Add behavior-based prompts (e.g., nudges if a user hasn’t logged in after 5 days).
Monitor and iterate on feature usage analytics to refine underused tools.
2. Strategy & Leadership – Focus on Retention of new converted subscribers
Finding: our funnel and onboarding pages are converting but early paid subscribers seem to be dropping off quickly.
Recommendation:
Shift some growth investment from acquisition to retention programs.
Review the view insight and invite team feature – make these features more interactive for new subscribers and also look into what our competitors are doing with these features
3. Marketing & Lifecycle Team – Target users in the US and UK
Finding: these countries experience the highest numbers of churn rates.
Recommendation:
Improve the product features to meet customers' needs in that region, especially the invite team, login and view insight features.
4. Product Experience - upgrade our product features to meet users needs
Finding: our product is not meeting some users needs
Recommendation:
Improve and upgrade our product feature, make it more user friendly and interactive , also consider what feature upgrades our competitors have put in place
Run discount for free users to encourage them subscribe to our paid packages
Create medium where users can give ratings on their user experience both on the app and web version
Create a medium where users can give their honest feedback on our product usage , that way we could know where the pain of our users are
Gather qualitative analysis ; analyze reviews and rating of our users on store apps such as app store or play store
Engage our users on social media to know where their pains are and where we can make upgrades to meet customers need
5. Data & Analytics Team – Build a Churn Prediction Model
Finding: Clear behavioral and support-based signals of churn are present.
Recommendation:
Use the current dataset to train a churn prediction model.
Build a dashboard that alerts customer success or marketing when users hit certain churn risk thresholds.
NEXT LINE OF ACTION FOR STAKEHOLDERS
1. Pilot an Early-Stage User Retention Program
Why: Most churned users show low engagement early on.
How:
Design a 30-day onboarding flow with milestone check-ins (via email, in-app nudges).
A/B test personalized tutorials or “get started” checklists for new users.
2. Set Up a Churn Monitoring Dashboard
Why: Stakeholders need real-time visibility into churn patterns.
How:
Build a real time dashboard
Churn trends over time
Churn by plan, billing issues, support tickets
At-risk user cohorts
3. Perform User Interviews or Surveys
Why: Quantitative data explains what, but not always why users churn.
How:
Survey churned users or those inactive for 30+ days.
Ask about missing features, frustrations, or reasons for leaving.
Share findings with product & UX teams.
4. Begin Building a Predictive Churn Model
Why: This allows the team to proactively act on risk signals before users churn.
How:
Use current data to train a simple logistic regression or decision tree model.
Score users weekly and send at-risk flags to the CRM or customer success team.
5. Review & Optimize the Basic Plan Offering
Why: Starter plan users have the highest churn.
How:
Conduct a value audit: is it missing features, support, or perceived value?
Try bundling attractive features or nudging upgrades earlier in the user journey.
view dashboard here
view project presentation here