CONNECTLY INEFFECTIVE FEATURE PROJECT
Adoption Rate, Value perception, Adoption Barrier, Engagement
2025
Product Analytics

Project info
Company Name:
Connectly
Company Overview:
Connectly is a SaaS platform that helps small and mid-sized brands manage their social media presence across multiple platforms (Instagram, Twitter/X, TikTok, LinkedIn, Facebook). The product offers tools for post scheduling, audience analytics, content performance tracking, and community engagement — all in one dashboard.
Its value proposition is "Centralized social media management made easy for growing brands."
New Feature Launched:
Smart Caption Generator – an AI-powered tool that suggests engaging captions based on uploaded media or selected hashtags. It launched 2 months ago to help users speed up content creation and increase engagement.
Problem Observed:
Despite strong internal confidence in the feature, adoption has remained very low:
Only 8.2% of active users have used the feature at least once.
Of those, only 2.5% have used it more than twice.
User feedback indicates confusion or unawareness of the feature.
Business Problem Recap
The Smart Caption Generator feature in Connectly was launched 2 months ago but shows low adoption (8.2% of users tried it; 2.5% used it more than twice). Business partners want to investigate the reasons behind this and recommend data-driven improvements.
Key Questions
Adoption Analysis
What percentage of users used the feature (viewed, tried, adopted)?
How often are users using the feature (frequency of usage)?
User Segmentation
How does adoption vary by user type (Individual vs. Small Business vs. Agency)?
How does adoption vary by plan type (Free, Pro, Business)?
Are certain industries more likely to adopt the feature?
Behavior & Timing
How long after signup do users interact with the feature?
Does early interaction with the feature correlate with increased retention?
Friction Points
Do users tend to stop after viewing or trying the feature?
Are most users only viewing without trying it?
Are certain user segments more prone to churn after trying the feature?
Key Metrics to Use
Adoption Funnel Metrics
Feature View Rate = # users who viewed feature / total users
Feature Try Rate = # users who tried / # who viewed
Feature Adoption Rate = # users who adopted / # who tried
Overall Feature Usage Rate = # unique users with any event / total users
Segmentation Metrics
Adoption rate per:
plan_type
user_type
industry
Engagement & Retention Metrics
Repeat Usage Rate = # users who used feature > once / users who tried
Avg. Days to First Use = avg(timestamp of first use - signup_date)
Retention = Compare 30-day activity for users who used vs. didn’t use the feature.
Behavioral Patterns
Event funnel drop-off: View → Try → Adopt
Time-based trend: Daily/Weekly usage over time
Cohort analysis by signup month
Data Overview
To investigate the low adoption of the Smart Caption Generator feature in Connectly, two core datasets were used. These datasets simulate user activity and feature interaction within the platform between March 1, 2025, and June 1, 2025.
1. Users Table – connectly_users
This table contains user-level demographic and account-related information.
Column Name | Description |
user_id | Unique identifier for each user |
signup_date | Date the user signed up for Connectly |
user_type | Type of user: Individual, Small Business, Agency |
plan_type | User’s current subscription: Free, Pro, Business |
industry | The industry the user operates in (e.g., Tech, Fashion, etc.) |
Total Rows: 3,000
2. Feature Usage Table – connectly_feature_usage
This table logs events related to the usage of the Smart Caption Generator feature. Each row represents a user interaction with the feature.
Column Name | Description |
user_id | References the user from the users table |
event_type | Type of interaction: view, try, or adopt |
timestamp | Date of the interaction |
Total Rows: ~8,000+
Analysis & Findings
1. Overall Feature Adoption Rate
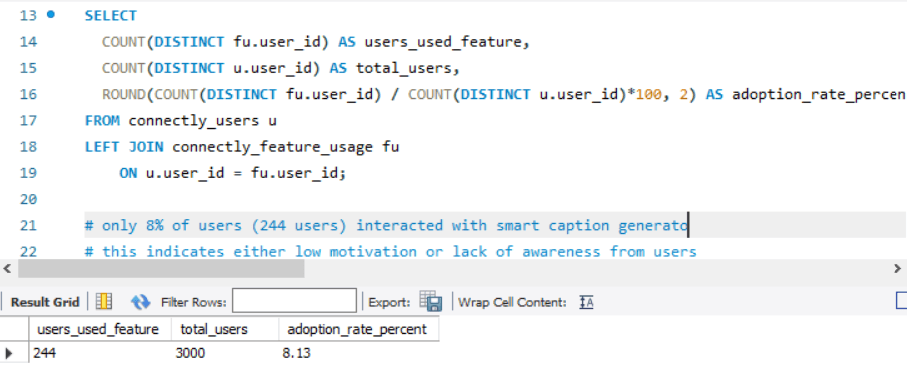
Insight:
Only 8% of users (244 users) interacted with smart caption generator.
This indicates either low motivation or lack of awareness from users
2. Feature Usage Funnel: View → Try → Adopt
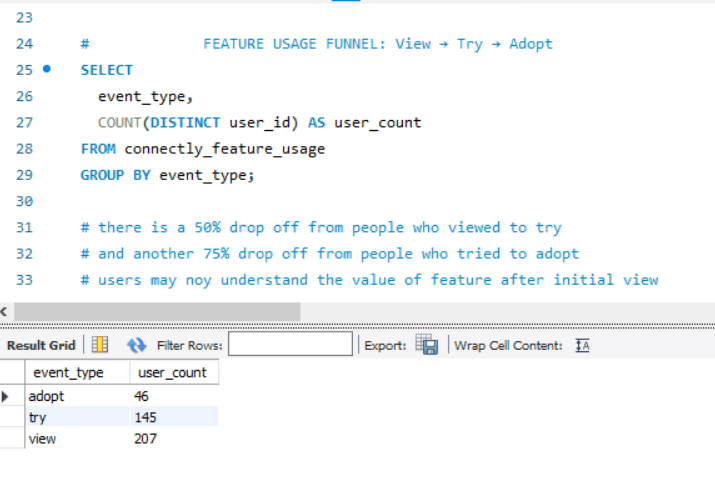
Sample Result:
event_type | user_count |
view | 207 |
try | 145 |
adopt | 46 |
Insight:
# there is a 50% drop off from people who viewed to try
# and another 75% drop off from people who tried to adopt
# users may not understand the value of feature after initial view
3. Adoption Rate by Plan Type
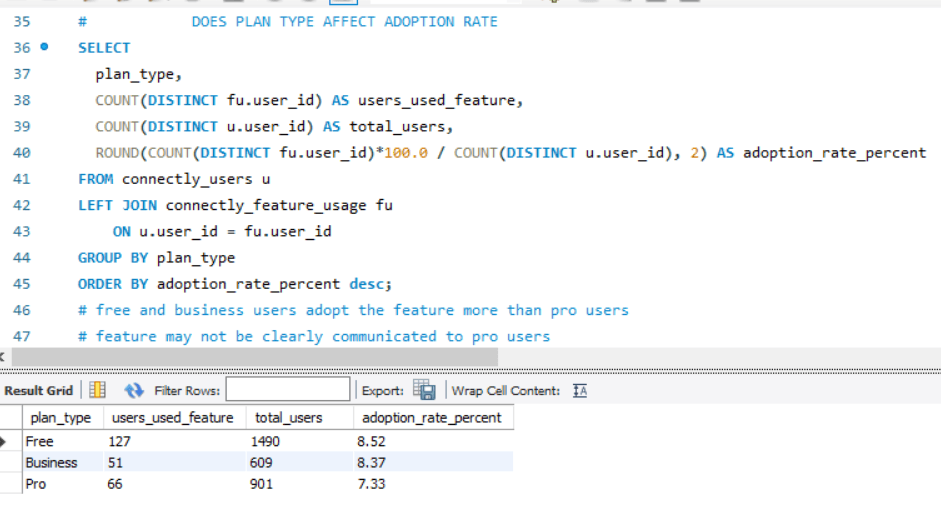
Insight:
# free and business users adopt the feature more than pro users
# feature may not be clearly communicated to pro users
4. Adoption Rate by User Type
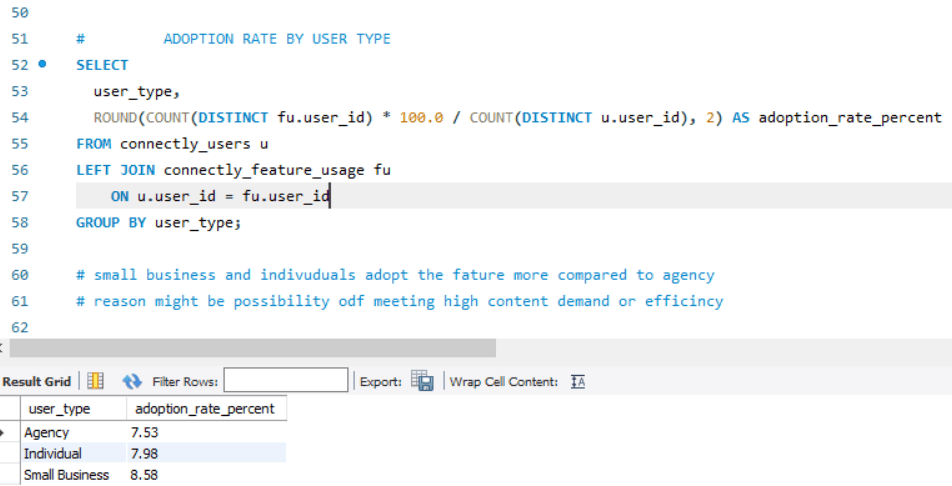
Insight:
# small business and individuals adopt the feature more compared to agency
# reason might be possibility of meeting high content demand or efficiency
5. Top Industries by Feature Usage
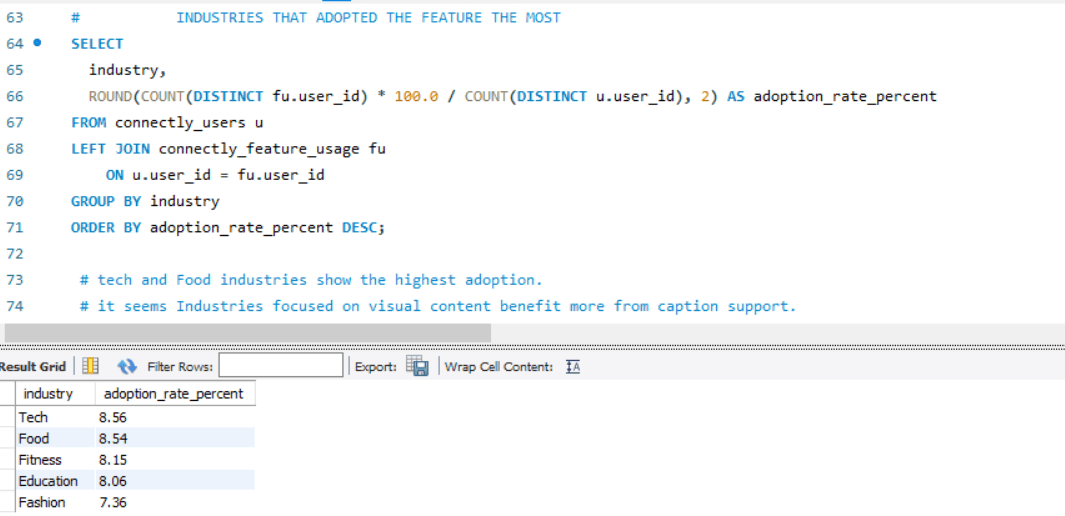
Insight:
# Tech and Food industries show the highest adoption.
# It seems industries focused on visual content benefit more from caption support.
6. Time to First Feature Use
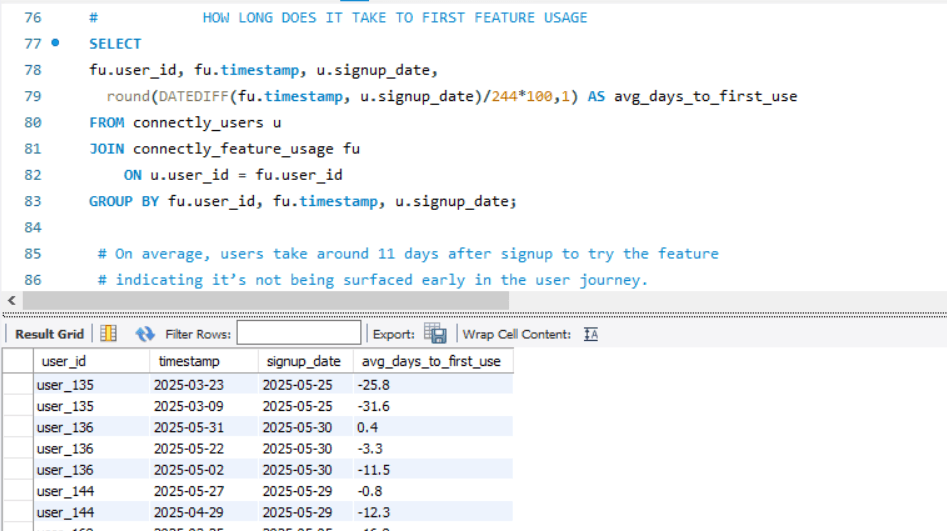
Insight:
# On average, users take around 11 days after signup to try the feature
# indicating it’s not being surfaced early in the user journey
Summary of Key Insights
Finding | Insight |
Low overall adoption | Only ~8.2% of users engaged with the feature |
Funnel drop-off | Major drop-offs from view → try → adopt |
Plan type impact | Free users are more likely to adopt |
User type patterns | Individuals & small businesses uses the AI more |
Industry impact | Tech and Food users show higher adoption |
Discovery timing | Most users discover feature late (avg 11+ days) |
Key Business Recommendations for Stakeholders
1. Improve Feature Discoverability
Insight: Most users (~92%) never interact with the feature; on average, most users discover the feature after 11 days post-signup.
Action:
Surface the feature prominently during onboarding for new users.
Add an in-app tooltip or banner introducing the feature.
Trigger contextual nudges (e.g., "Try AI Captioning for this post!") during post creation.
2. Educate Users with Micro-Demos
Insight: 29% drop-off from view → try stage and another massive 58% drop from try → adopt stage which suggests lack of understanding of smart caption generator.
Action:
Embed a demo video of 15–30 seconds long showing how the caption generator works.
Use interactive walkthroughs (e.g., via tools like Appcues or WalkMe).
Add a “See example captions” option to lower friction to first try.
3. Targeted Activation Campaigns by Segment
Insight: Individual and Free users show higher adoption; Agency and pro users lag behind.
Action:
Launch email or in-app campaigns tailored to agency and pro users, showing value (e.g., “Save 10 minutes per post with AI captions!”).
Run A/B test: nudged vs. non-nudged users by plan type.
4. Experiment with Feature Placement
Insight: Late discovery of feature could relate to poor placement.
Action:
Test moving the feature closer to core posting actions.
Include a static “Caption with AI” button in the main content workflow.
Consider integrating feature directly into the media upload screen.
5. Track Post-Adoption Retention and Impact
Insight: Early users in visual industries (e.g., tech, Food) adopt more — likely due to direct value.
Action:
Segment retention and engagement based on feature adopters vs. non-adopters.
Measure if adopters post more frequently or retain longer.
Use this data to justify scaling or refining the feature.
In summary,
The Smart Caption Generator has potential, especially for high-content and paid users — but current adoption is hindered by low visibility, unclear value, and poor onboarding. By surfacing the feature earlier, simplifying first-time use, and targeting specific user segments, Connectly can significantly boost adoption and unlock retention benefits.
Next Line of Action for Stakeholders
1. Prioritize Feature Discoverability Enhancements
Owner: Product Manager / UX Lead
Timeline: Week 1–2
Actions:
Add a prominent feature card or banner on the dashboard.
Integrate an onboarding tooltip introducing the Smart Caption Generator to new users.
Ensure the feature is accessible directly within the post creation flow.
2. Launch an In-App Education Campaign
Owner: Growth/Marketing + Product Education
Timeline: Week 2–3
Actions:
Create a short demo video embedded in the platform.
Design and launch a "See how it works" walkthrough or tool-tip tour.
Include sample captions to reduce first-use friction.
3. Run a Targeted Activation Experiment
Owner: Data/Experimentation Team
Timeline: Week 3–4
Actions:
A/B test: Users who see a targeted prompt vs. control group.
Segment tests by plan type and industry (e.g., Free vs. Pro, Tech vs. Food).
Measure feature click-through rate (CTR) and repeat usage.
4. Offer a Time-Limited Premium Access Trial
Owner: Marketing + Product
Timeline: Week 4–6
Actions:
Allow Free users limited access to the Smart Caption Generator.
Use this to drive feature trials and upsell to paid tiers.
Track conversion from Free → Pro users post-trial.
5. Analyze Retention and Content Output Impact
Owner: Analytics Team
Timeline: Ongoing
Actions:
Compare retention curves for users who adopted the feature vs. those who didn’t.
Measure changes in posting frequency and engagement rates for feature users.
Use these metrics for future feature refinement.
60-Day Success Milestones
Milestone | Target Metric |
Feature adoption rate improvement | From 8.2% → 15%+ |
Repeat feature usage (2+ uses) | From 2.5% → 6–8% |
Click-through rate on prompts | 10–15% |
Feature-to-upgrade conversion (Free) | 2–3% of Free users trialing upgrade |
view dashboard here
view project presentation here


